
Where does funding go?
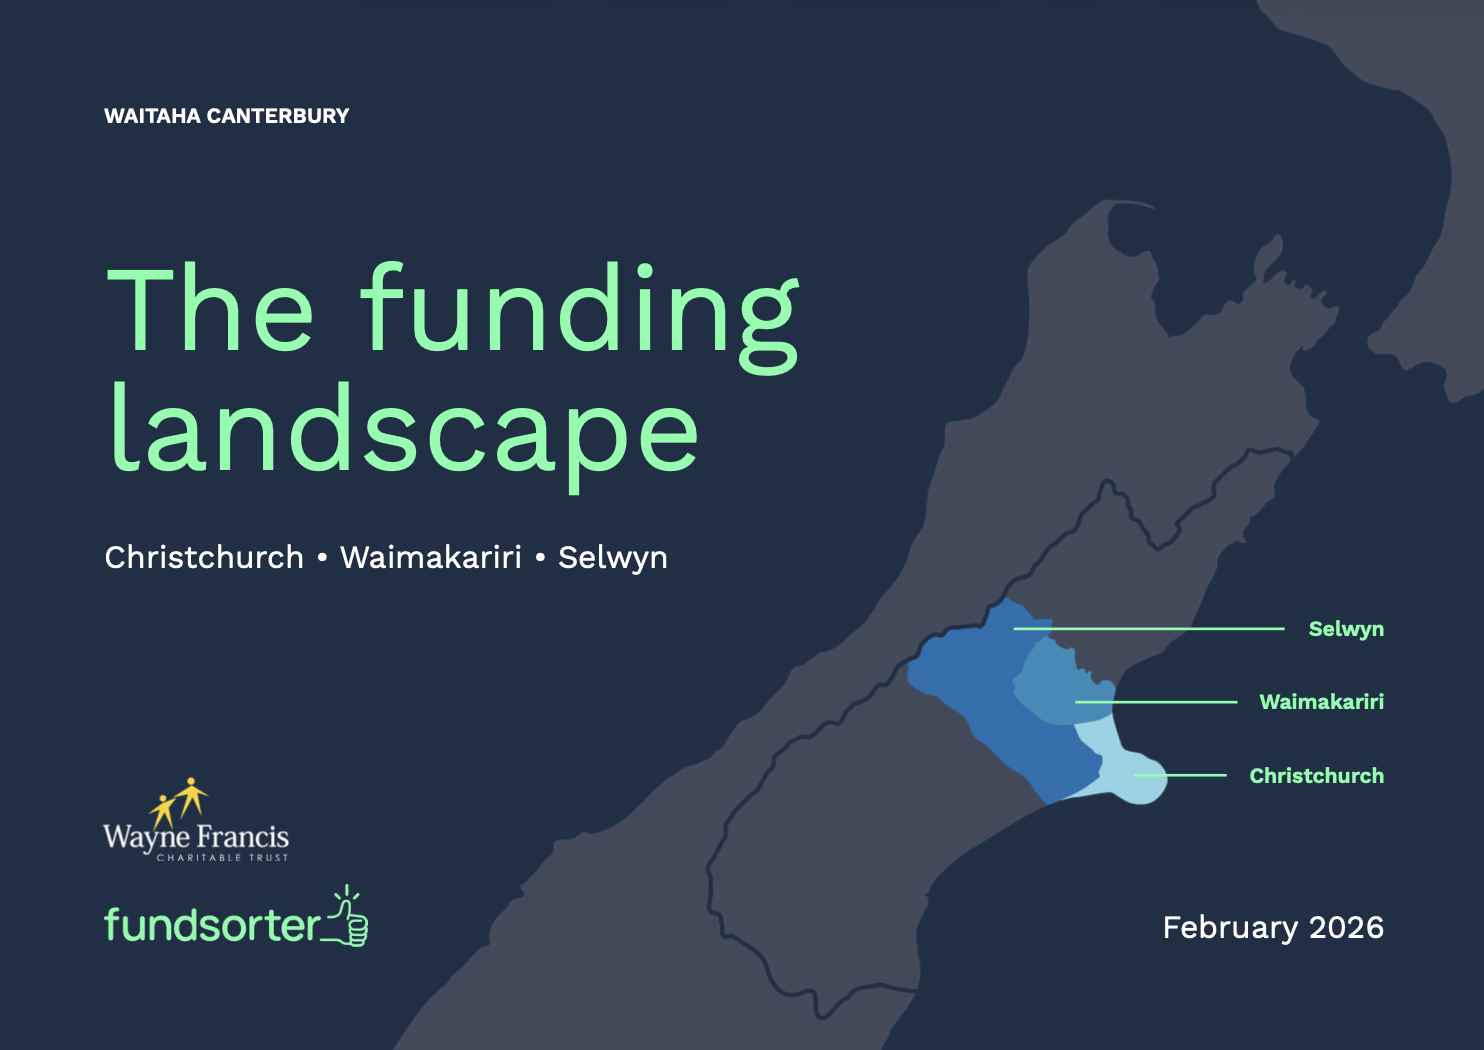
We talk a lot about funding priorities in community and philanthropy. Less often do we see how those priorities translate into actual grants. Fundsorter, with the support of the Wayne Francis Charitable Trust, created the Funding Landscape: Waitaha Canterbury report to bridge that gap. By analysing 6,088 contestable grants totalling more than $68 million across Christchurch, Selwyn and Waimakariri, the report offers a regional snapshot of both stated intentions and real financial distribution.
The report focuses on local contestable grants, excluding national funders, proactive funding and impact investment. It provides accessible, aggregated data about funding: where it goes and what funders prioritise. We believe that greater transparency enables more informed decision-making. Regular snapshots will allow us to see how challenges shift over time, whether funding responds to those shifts, and where persistent gaps remain.
And there are gaps. Here are some that stood out for us.
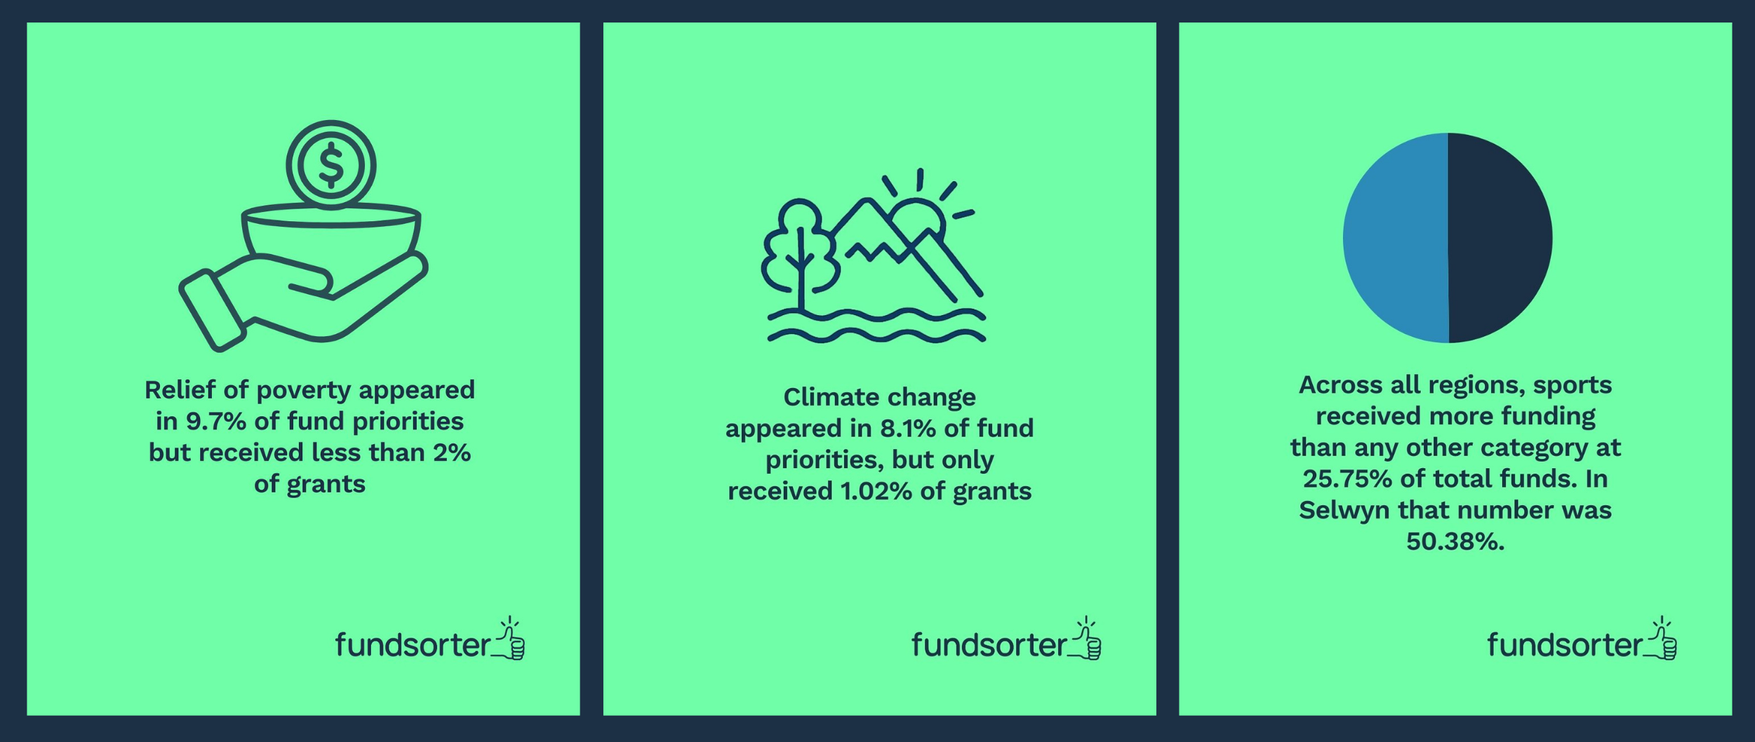
Climate Change. Across the three territorial authorities, climate change was listed as a priority by 8.1% of funders, yet received just 1.03% of total grants. These figures sit alongside a sharp rise in climate-related emergencies across New Zealand. This year alone, eight severe weather-related states of emergency have already been declared. For many regions, climate impacts are no longer abstract future risks but present-day realities.
Relief of Poverty. In Christchurch, relief of poverty appears in 9.7% of funders’ priorities but receives just 1.98% of grants. Just last week, Stats NZ released data showing that 1 in 7 children in Aotearoa are living in poverty.
Sport accounts for 25.7% of total funding across the region, and in Selwyn and Waimakariri it represents closer to half of all grant funding. Much of this is driven by Class Four gaming trusts, which distribute a significant share of contestable funding and have historically strong ties to sporting institutions. Sport plays an very important role in well-being, social cohesion and other areas of life, but the scale of this concentration impacts what is possible elsewhere in communities.
Funding favours the universal over the marginalised. The data suggests that funding skews towards issues that are less identity based, less political and more universal. We are more likely to fund arts, sports and education rather than social justice, human rights or issues focused on specific marginalised communities. The one exception to this is Māori. It would be interesting to examine retrospective data to see where and when that trend began to emerge.
The report doesn’t tell the whole story, but it does surface information. It provides an independent evidence base to inform funding strategy, support more coordinated and complementary regional philanthropy, equip community organisations with credible data to strengthen advocacy, and surface inequities that are not visible at the level of a single grant or funder. Where there are gaps in funding we can start to examine why - is it because there are barriers to applications? Or a lack of translation between priorities and decision-making?
Consistent, accessible data across Aotearoa could help us collectively identify gaps, collaborate and align funding distributions with our collective values and aspirations. Better data does not solve inequity on its own. It does, however, give us a shared starting point for making funding work better, together.